Reporting on the trends in sentiment of your app reviews is simple with Appbot. The Appbot Sentiment page makes it easy to see trends in sentiment over time.
Appbot uses a proprietary AI-powered algorithm to determine the sentiment of each review.
Appbot’s sentiment analysis primarily references the text content of the review. For app reviews or other data sources with a star rating we also reference the star rating.
Appbot’s sentiment algorithm sorts app reviews and other data sources into 4 categories.
Here’s a brief description of each category to help you interpret the sentiment results:
- Positive Sentiment: The comment is mostly positive.
- Negative Sentiment: The comment is mostly negative.
- Neutral Sentiment: The comment lacks any strong sentiment.
- Mixed Sentiment: The comment has mixed or conflicting sentiment.
The Sentiment page reports on Reviews with text only, not overall Ratings. Learn about the difference between Reviews and Ratings here.
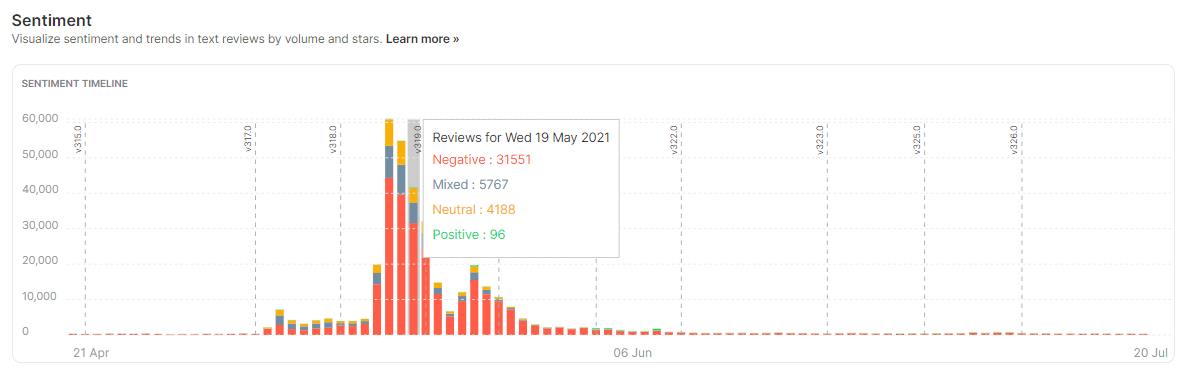
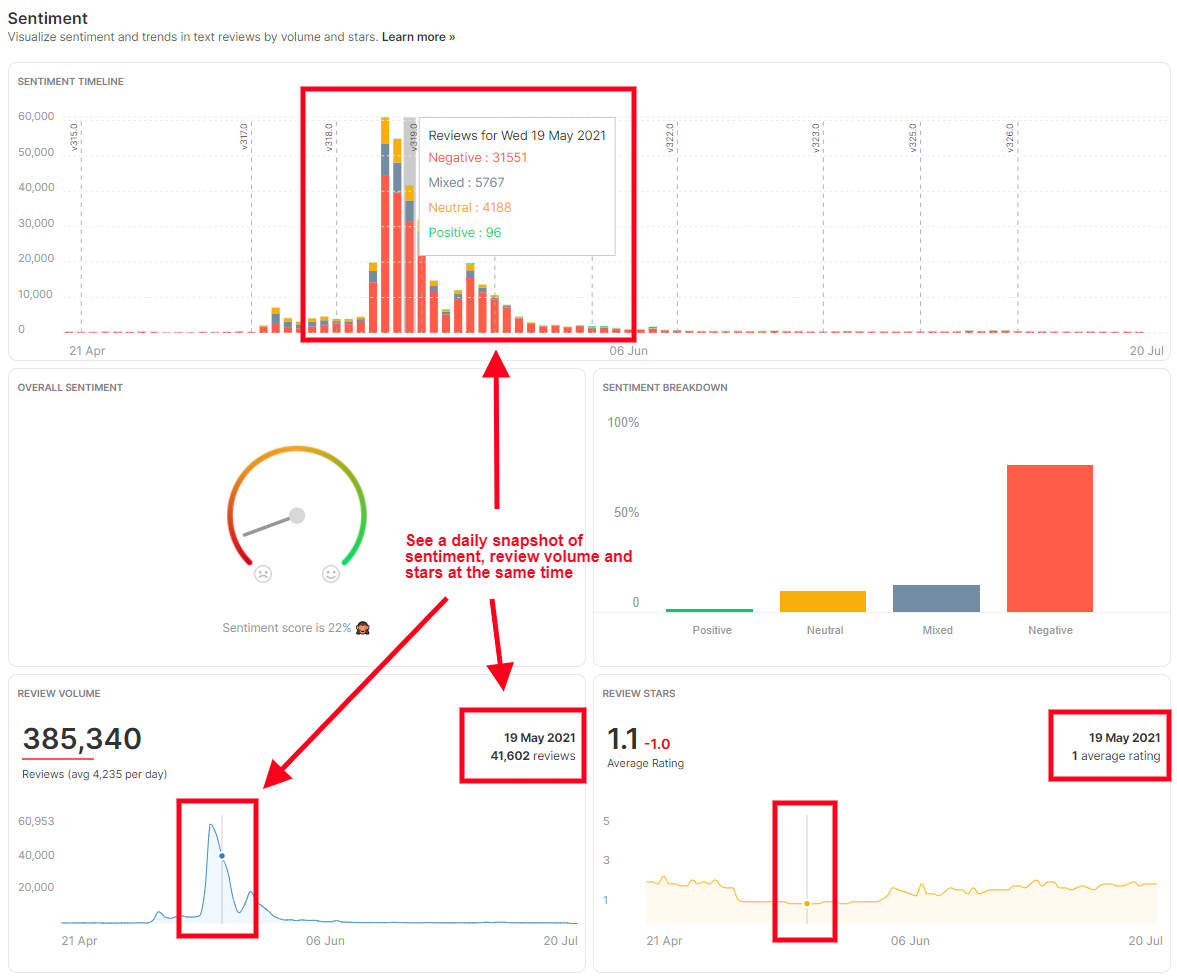
Sentiment Timeline
The Sentiment Timeline helps to understand trends in positive and negative sentiment over the time period you’re examining. Each bar represents a day. ‘Positive’ sentiment is marked with green, ‘Neutral’ with orange, ‘Negative’ with red and ‘Mixed’ with blue. Hover over a bar to see the breakdown details as shown.
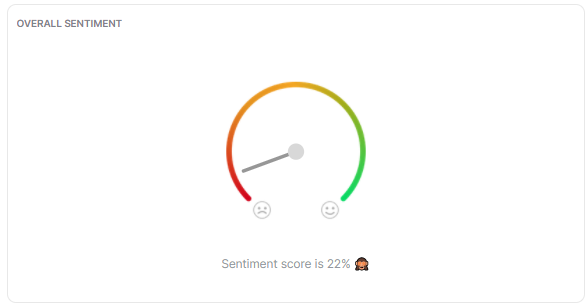
Overall Sentiment
The Overall Sentiment chart provides a measure of the average overall sentiment for the filters you have selected. This chart is designed to help you understand how much scope for improvement there is. It also shows your Sentiment score at the bottom. Read more about how the sentiment score is calculated here.
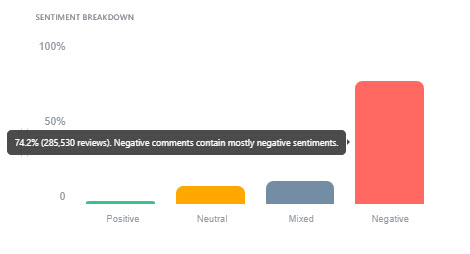
Sentiment Breakdown
The Sentiment Breakdown chart shows the proportion of reviews that contain Positive, Negative, Neutral and Mixed sentiment for the selected reviews. Hover over the sentiment bars to see the overall percentage and number of reviews per category.
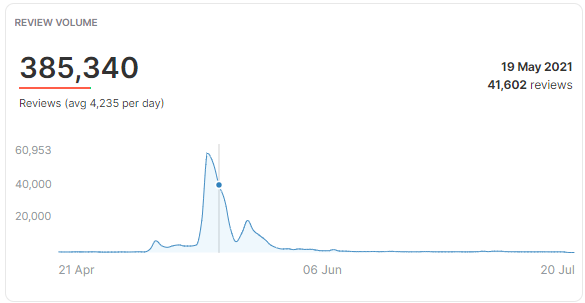
Review Volume
The Review Volume chart shows the number of source reviews for the selected time period.
On the left side of the chart, you’ll see the total number of reviews for the period, a colored sentiment bar with sentiment for the period, and the average number of reviews per day during the period. On the right side, you’ll see the number of reviews for a particular day. Hover over the chat to see the Review Volume on any day, within the selected time period.
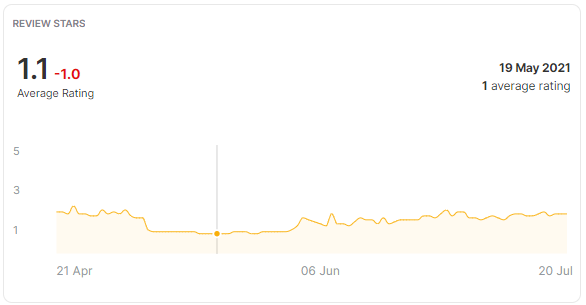
Review Stars
The Review Stars chart shows your average star rating for the selected time period.
On the left side of the chart, you’ll see the average star rating for the selected time period. On the right side, you’ll see the average star rating for a particular day. Hover over the chat to see the average star rating on any day, within the selected time period.
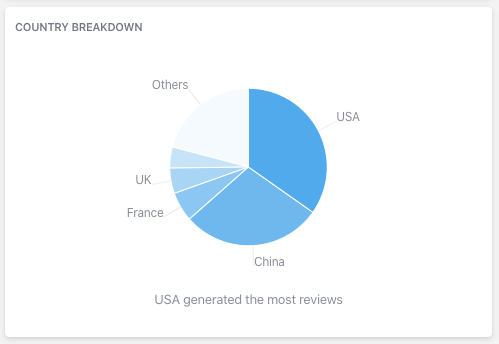
Country/Language Breakdown
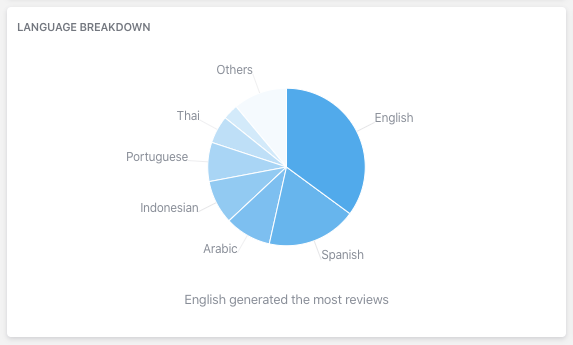
For iOS apps, you’ll see a chart broken down into specific countries. The Country Breakdown allows you to see where the majority of the app reviews are coming from. For Google Play apps a Language Breakdown will be shown instead.
Hover over any segment of the chart to see the total reviews and total review percentage for that country/language during the selected time period.
iOS apps:
Google Play apps:
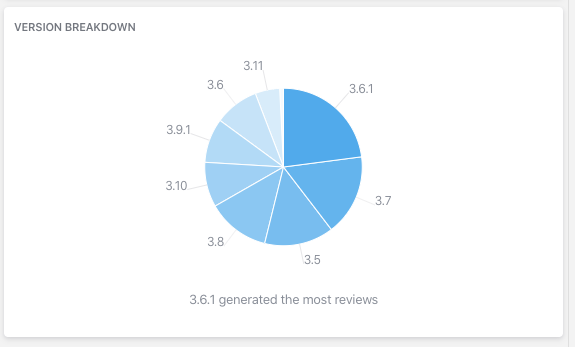
Versions
The Versions chart lets you compare the volume of app reviews between different app versions. You can hover over any of the segments to see the specific review volume and the percentage of total reviews.
The Versions report works automatically for iOS apps. To see Version data for your Google Play reviews you will need to link your Google Play Developer Console to Appbot.
More data in one snapshot
Tip: Hover across the Sentiment Timeline, Review Volume chart and Review Stars chart to get a daily snapshot of all these metrics for a particular day.
If you need any further assistance on analyzing positive sentiment and negative sentiment, don’t hesitate to contact us with any questions or check out our FAQ section here.