Appbot Countries allows you to geographically analyze your app review sentiment. Countries also help you see where the majority of your reviews are coming from.
Note: the Countries tool is only available for iOS apps. 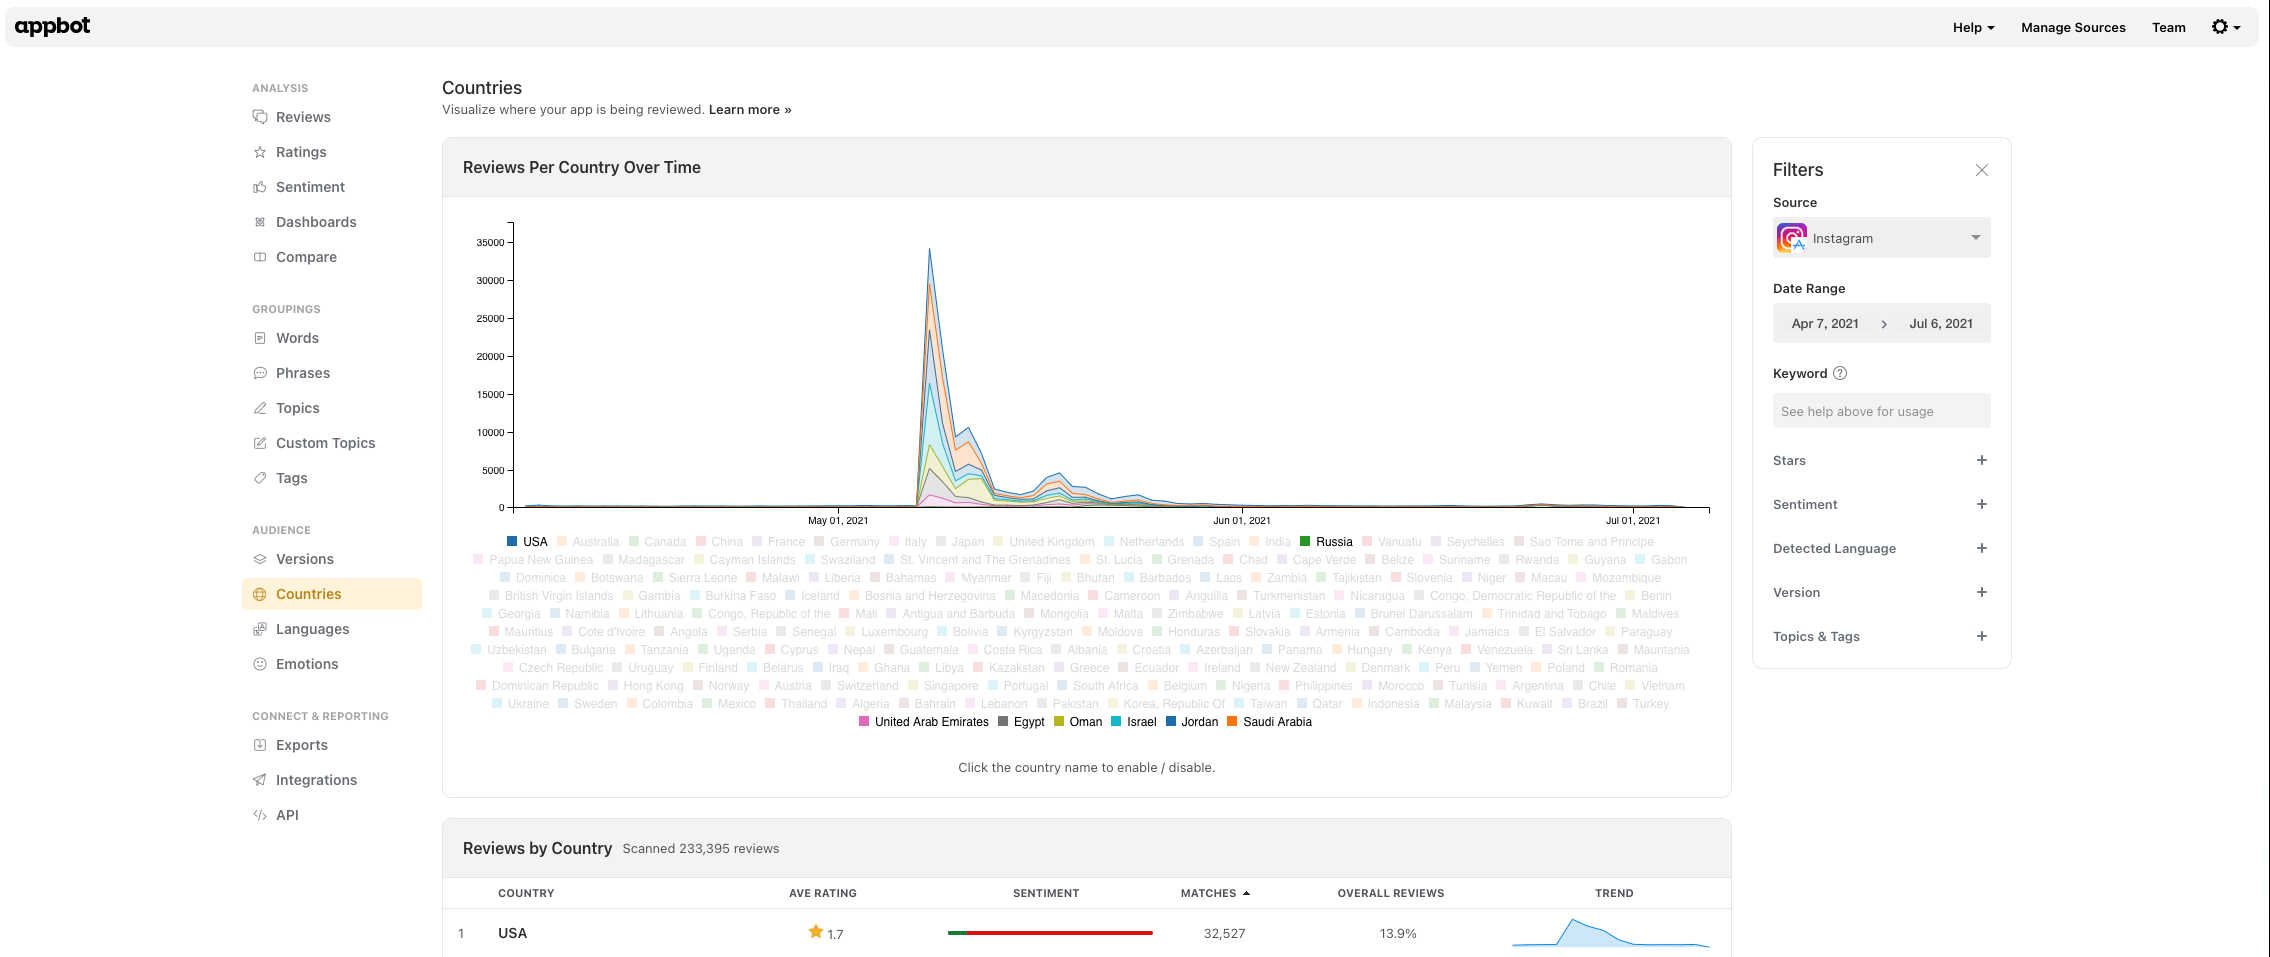
In the Filters pane on the right of the page, you can apply filters to analyze the language of reviews from a particular:
- time period,
- keyword,
- star rating,
- sentiment score,
- custom topics and tags and
- whether the review has been replied to (Google Play only).
At the top of the page, you will see the Reviews By Country Over Time graph with a list of countries in the legend below. Clicking on any of the countries from the legend will show or hide that country on the graph. By default, only the 8 countries receiving the most app reviews are turned on.
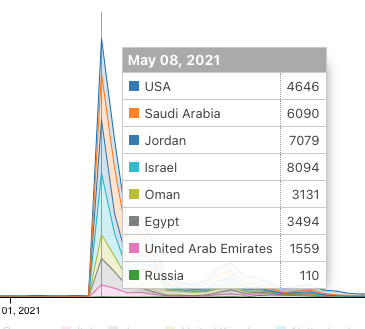
Hovering your cursor on the graph will show you a daily snapshot for the day you hover over. If you’ve set your date range to ‘Last 365 Days’ or later, you’ll see a weekly snapshot.
Below the graph is a list of all the countries your app has reviews from. Countries are listed according to the volume of reviews for each country with the highest at the top.
Each line gives you a high-level overview of your app sentiment and review volume for that particular country. You can see:
- the average rating of your app,
- the sentiment breakdown,
- how many reviews have been left from that country,
- what percentage of your overall review volume that country makes up and
- a trend graph showing your review volume over time.
Click on any of the items in the table header to sort by that item. Click on the same item again to invert the order of sorting (e.g. A-Z sort becomes Z-A).
If you want to drill deeper into a particular country, simply click on the country from the list and you’ll see a list of all the reviews for that country that match your filters.
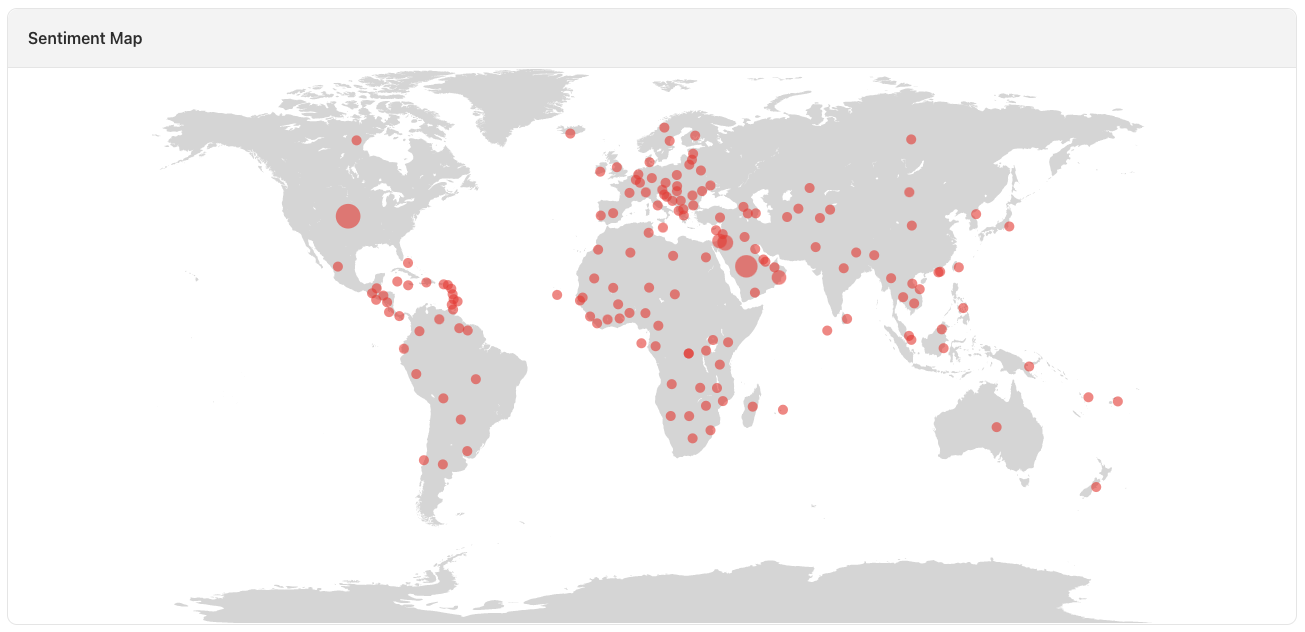
Sentiment Map (iOS only)
The Sentiment Map shows your distribution of app reviews by country, colored according to the review sentiment; green for positive, yellow for neutral and red for negative.
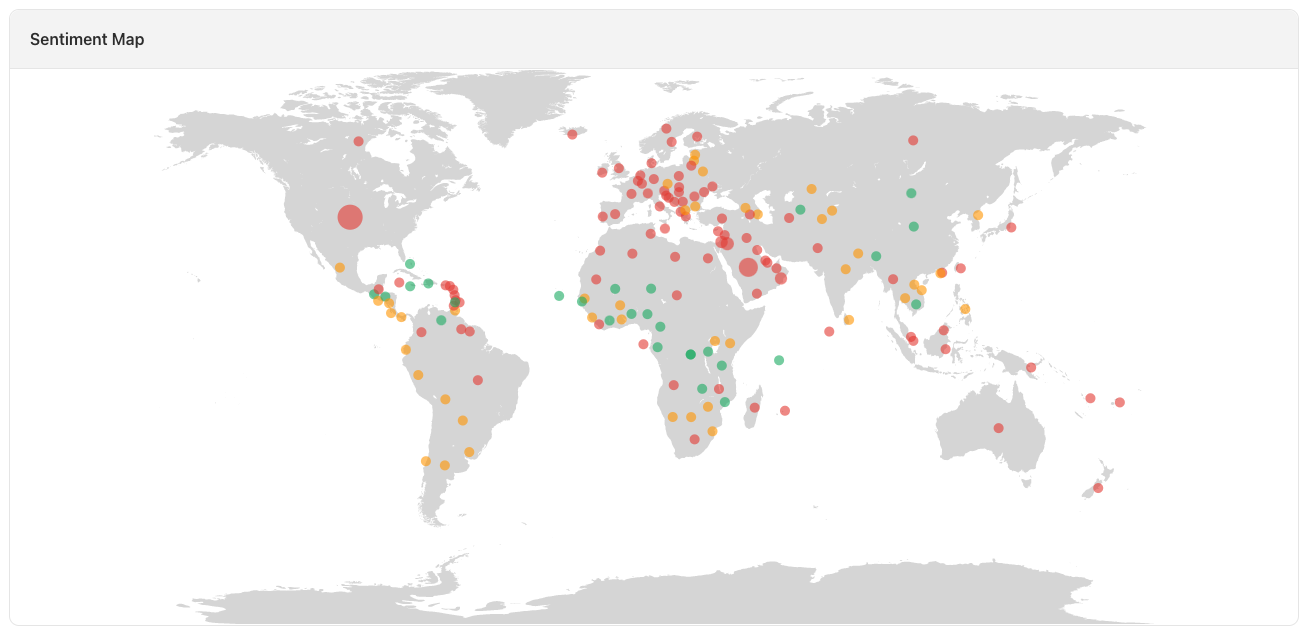
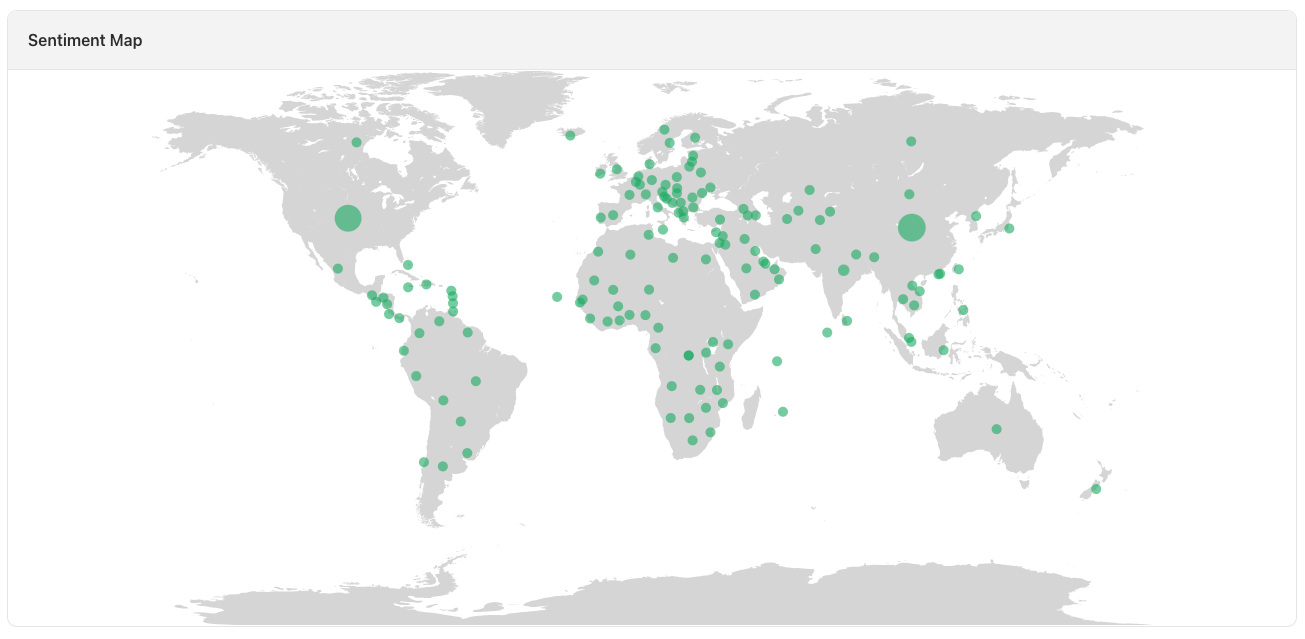
Tip: To see where your positive reviews are coming from, refine the map to only show your 4 and 5 star ratings, and have a look at where the largest green dots are.
Similarly, to see where your negative reviews are coming from, refine the map to only show your 1 and 2 star ratings, and now look at where the largest red dots are.
If you need any further assistance, hesitate to contact us with any questions or check out our FAQ section here.