I’ve always focused on the USA charts as the main source of rankings and income, but I also know a number of developers who make a good living from making apps specifically for the Australian market.
But how do the charts vary from the USA to Australia? And how do they differ from a completely different market like China?
We took a snapshot of the top charts in the US, Australia and China on Monday May 18th, 2015 to see what the difference really is. Do the same apps dominate everywhere, or is making an app for a specific region a valid approach?
An app has been defined with one with a unique identifier. There are a couple of apps that break this rule, such as Real Racing 3, that are submitted as different apps in the US and other countries.
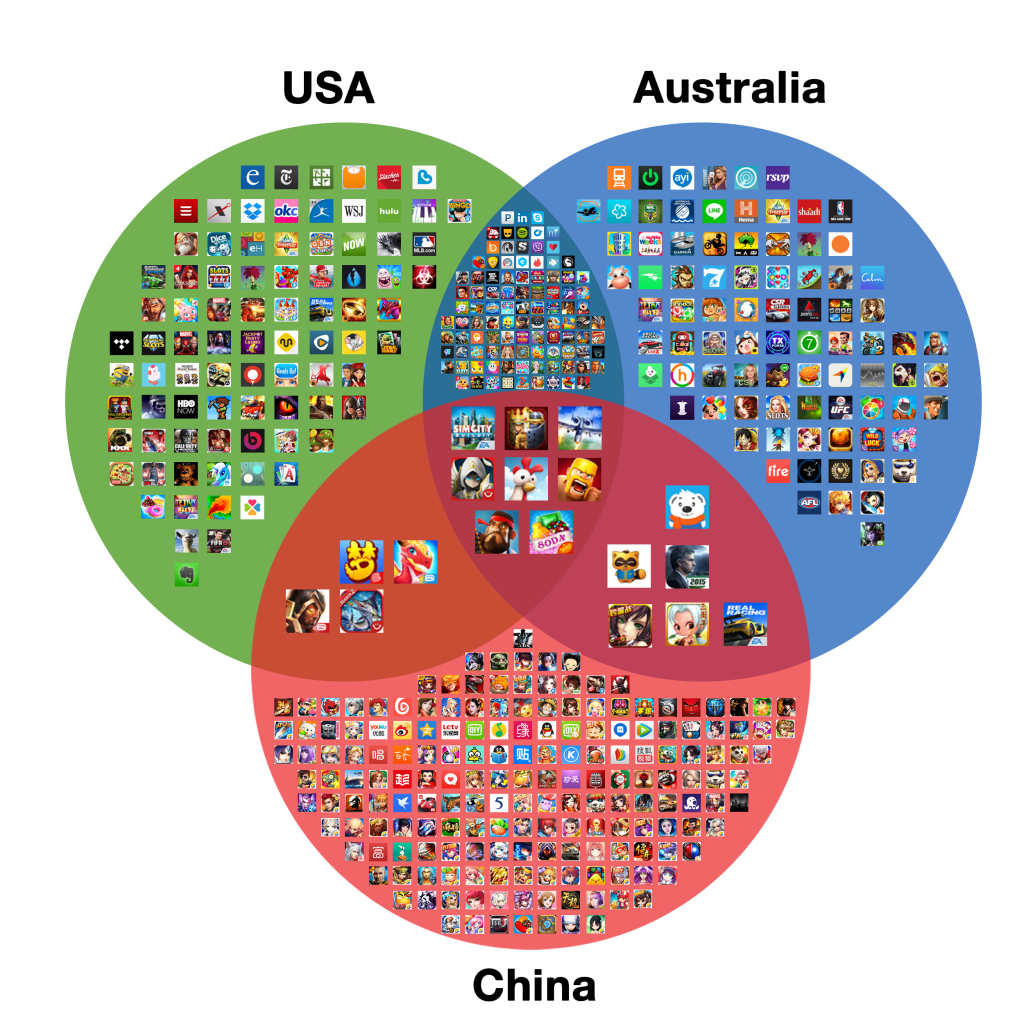
Grossing Top 200
Surprisingly (to me at least), only 8 top grossing apps appeared in all 3 countries.
- Clash of Clans
- Candy Crush Soda Saga
- Boom Beach
- Hay Day
- Summoners War
- SimCity BuildIt
- Empires & Allies
- Clash of Kings – Last Empire
US & Australia had the biggest crossover with another 103 apps appearing in both countries. While the USA and China only shared another 4 apps and Australia and China 6.
This means a whopping 182 apps, or 91%, of apps in China only weren’t top in the top 200 grossing in Australia, or the US
Australia had 83 (41.5%) and the USA 85 (42.5%) apps that were specific to the charts in their country.
| Count | % | |
|---|---|---|
| All Countries | 8 | 4% |
| USA & China (Excluding All) | 4 | 2% |
| USA & Australia (Excluding All) | 103 | 52% |
| China & Australia (Excluding All) | 6 | 3% |
| USA Only | 85 | 43% |
| China Only | 182 | 91% |
| Australia Only | 83 | 42% |
Paid Top 200
Almost double the number of top paid apps appeared in all 3 countries compared to top grossing, with 15 (7.5%).
- Minecraft Pocket Edition
- Plague Inc.
- Facetune
- Toca Lab
- Enlight
- Afterlight
- Sky Guide: View Stars Night or Day
- Mickey’s Shapes Sing-Along by Disney Imagicademy
- Monument Valley
- Camera+
- Angry Birds
- Knights of Pen & Paper 2
- Sleep Cycle alarm clock
- Runtastic PRO GPS Running, Walking, Jogging, Fitness Distance Tracker and Marathon Training
- Infinity Blade III
Still 171 (85.5%) of apps in China didn’t appear in the top apps in the USA or Australia
USA & Australia shared another 82 apps, so almost half were the same.
| Count | % | |
|---|---|---|
| All Countries | 15 | 8% |
| USA & China (Excluding All) | 8 | 4% |
| USA & Australia (Excluding All) | 82 | 41% |
| China & Australia (Excluding All) | 6 | 3% |
| USA Only | 95 | 48% |
| China Only | 171 | 86% |
| Australia Only | 97 | 49% |
Free Top 200
Just like top grossing, top free shared 8 apps over the 3 countries. Two of which are Apple’s own apps.
- iTunes U
- Find My iPhone
- Uber
- Quetzalcoatl
- Candy Crush Soda Saga
- Boom Beach
- Despicable Me: Minion Rush
- Nom Cat – Endless feeding frenzy arcade game
Over 50% of apps were unique in Australia, 94.5% (!!) unique to China and 50% unique in the USA.
| Count | % | |
|---|---|---|
| All Countries | 8 | 4% |
| USA & China (Excluding All) | 2 | 1% |
| USA & Australia (Excluding All) | 90 | 45% |
| China & Australia (Excluding All) | 1 | 1% |
| USA Only | 100 | 50% |
| China Only | 189 | 95% |
| Australia Only | 101 | 51% |
Conclusion
My eyes have definitely been opened to the uniqueness of the top charts in different countries. Many of these apps are weather apps, TV guides, banking apps, tourism and recipe apps specific to the countries they are charting.
For your next app it’s worth considering an app specifically for a single market.