App Review Volume
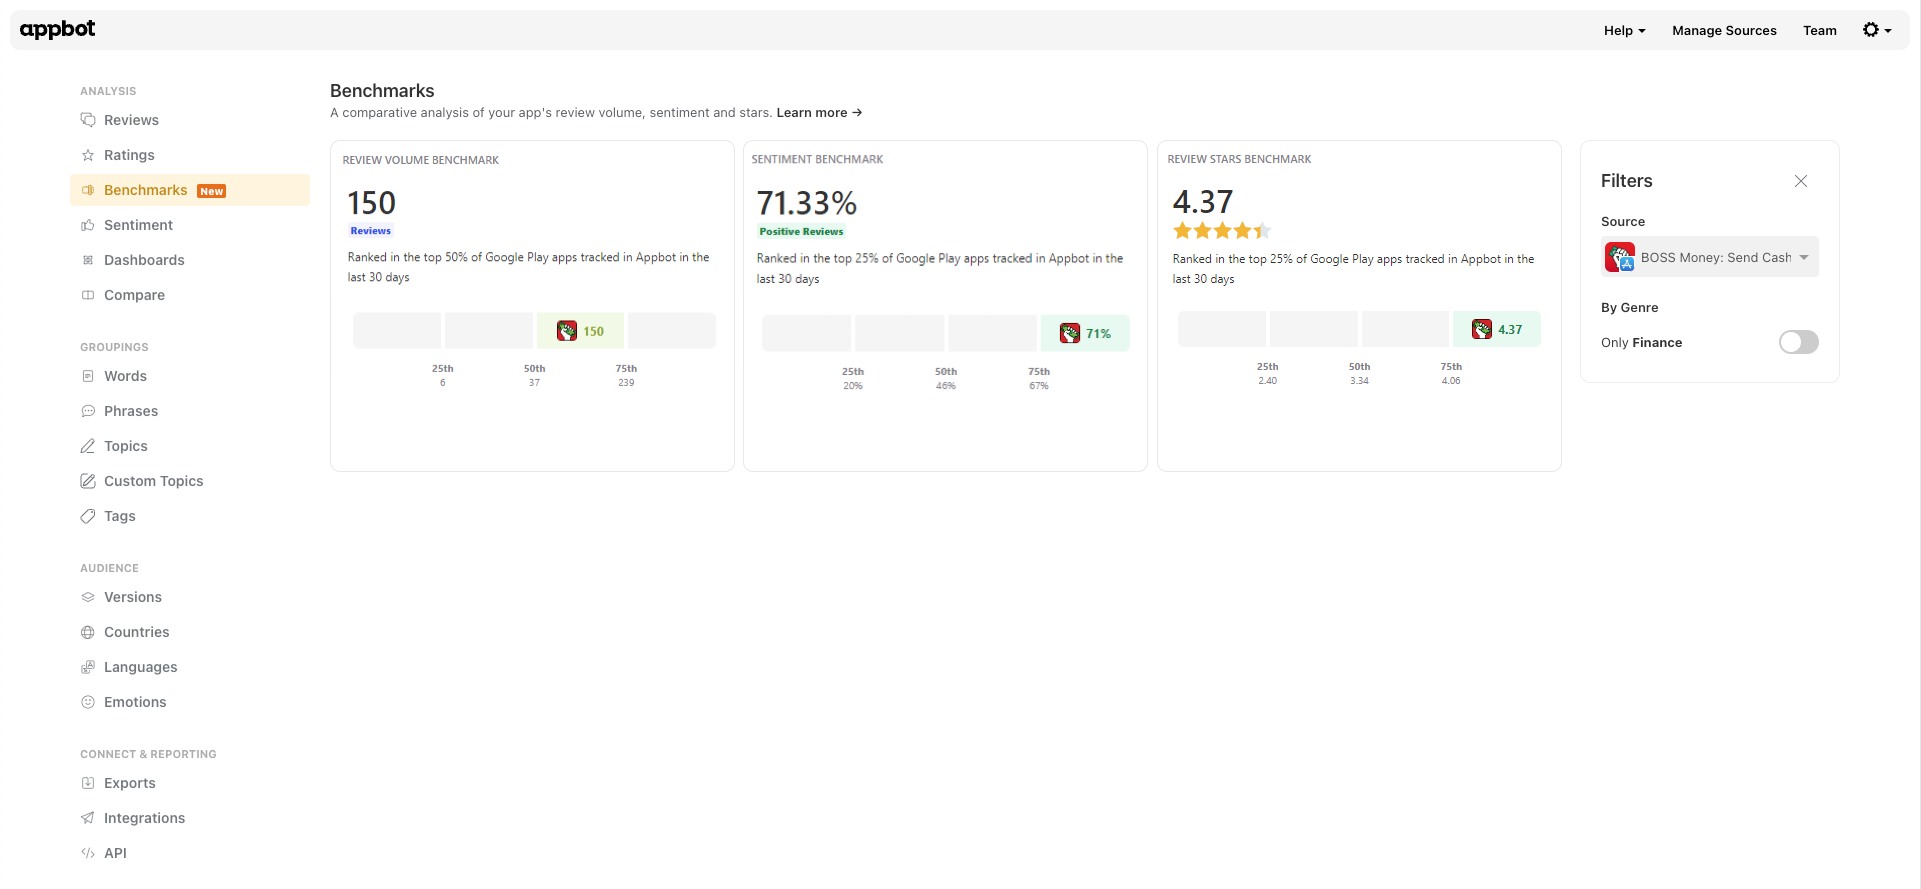
The widget presents the review volume in a visually engaging manner. You’ll find a numerical value representing your app’s review count, along with quartiles – Q1, Q2, and Q3 – giving you a broader perspective on the distribution of review volumes.
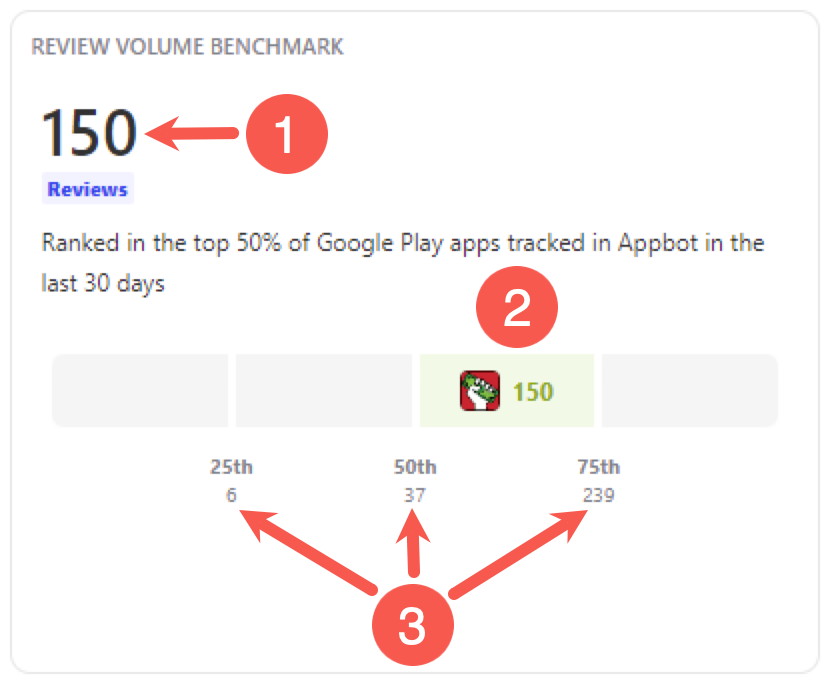
- The number of reviews the selected app has received in the past 30 days (1).
- The quartile position of the app. In the above example the app has 150 reviews and it is in Q3 or the top 50% of review volume (2).
- The quartiles, percentile and the number of reviews for each one. For example, Q1 or the 25th percentile and has 6 reviews.
App Review Ratings
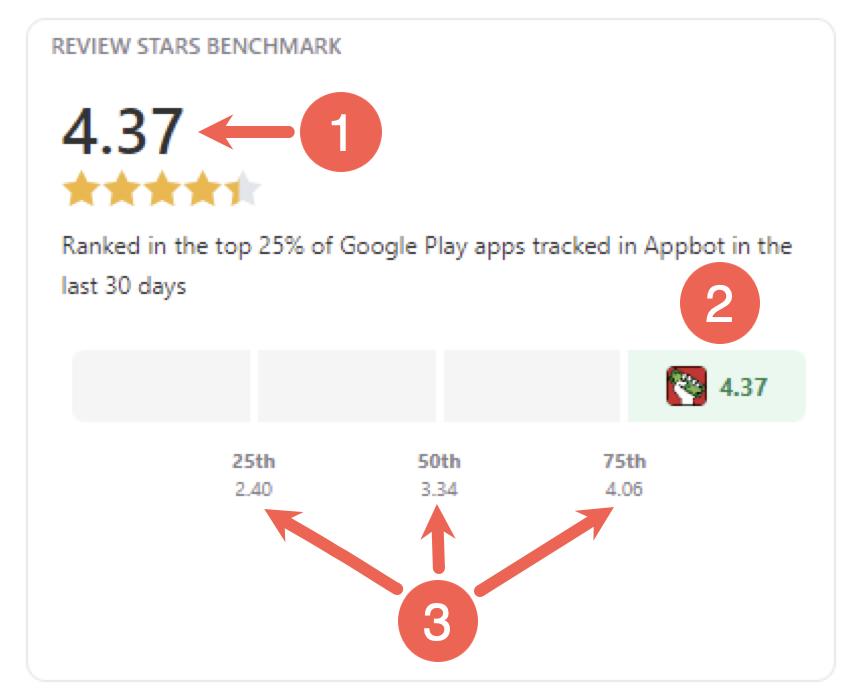
The widget displays your app’s average review ratings using a star-based system. You’ll see the average rating represented in stars, along with quartiles – Q1, Q2, and Q3 – to provide a comprehensive overview of the rating distribution among other apps.
- The average star rating for the selected app in the last 30 days (1).
- The app’s quartile position. In the example above it is in Q4 or top 25% of the apps as it has a higher average than 75% of the apps (2).
- Shows the quartiles, percentiles and the positive sentiment percentage for each. The average star rating for the Q2 or 50 percentile is 3.34 (3).
App Review Sentiment
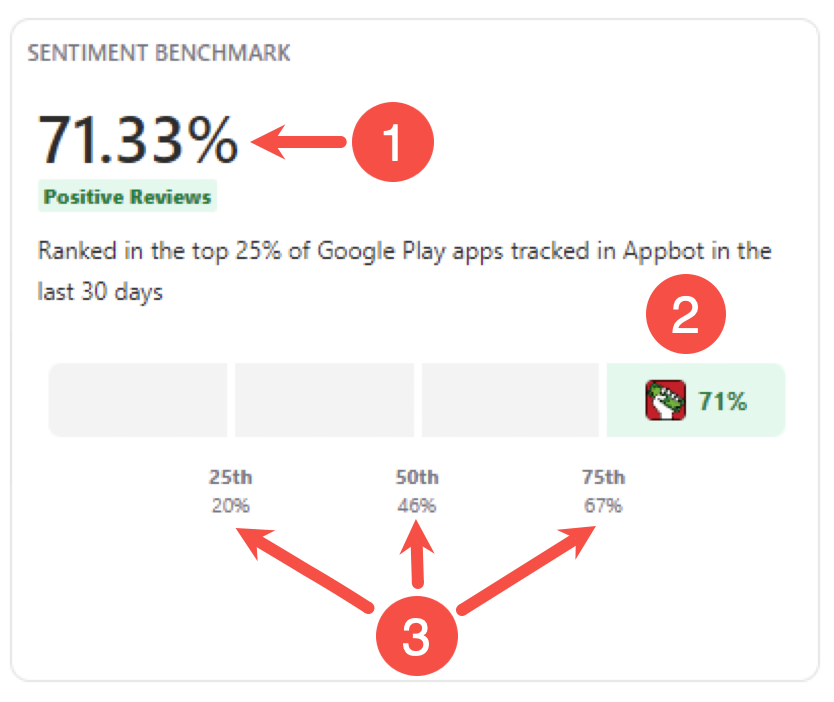
The Sentiment widget offers valuable insights into user sentiment and opinions towards your app compared to rivals. It focuses on the percentage of reviews with positive sentiment.
This widget analyzes the sentiment of user reviews and presents the percentage of positive reviews. Higher percentages indicate a greater level of positivity towards your app, whereas lower percentages may suggest areas for improvement.
- The percentage of positive reviews for the selected app (1.)
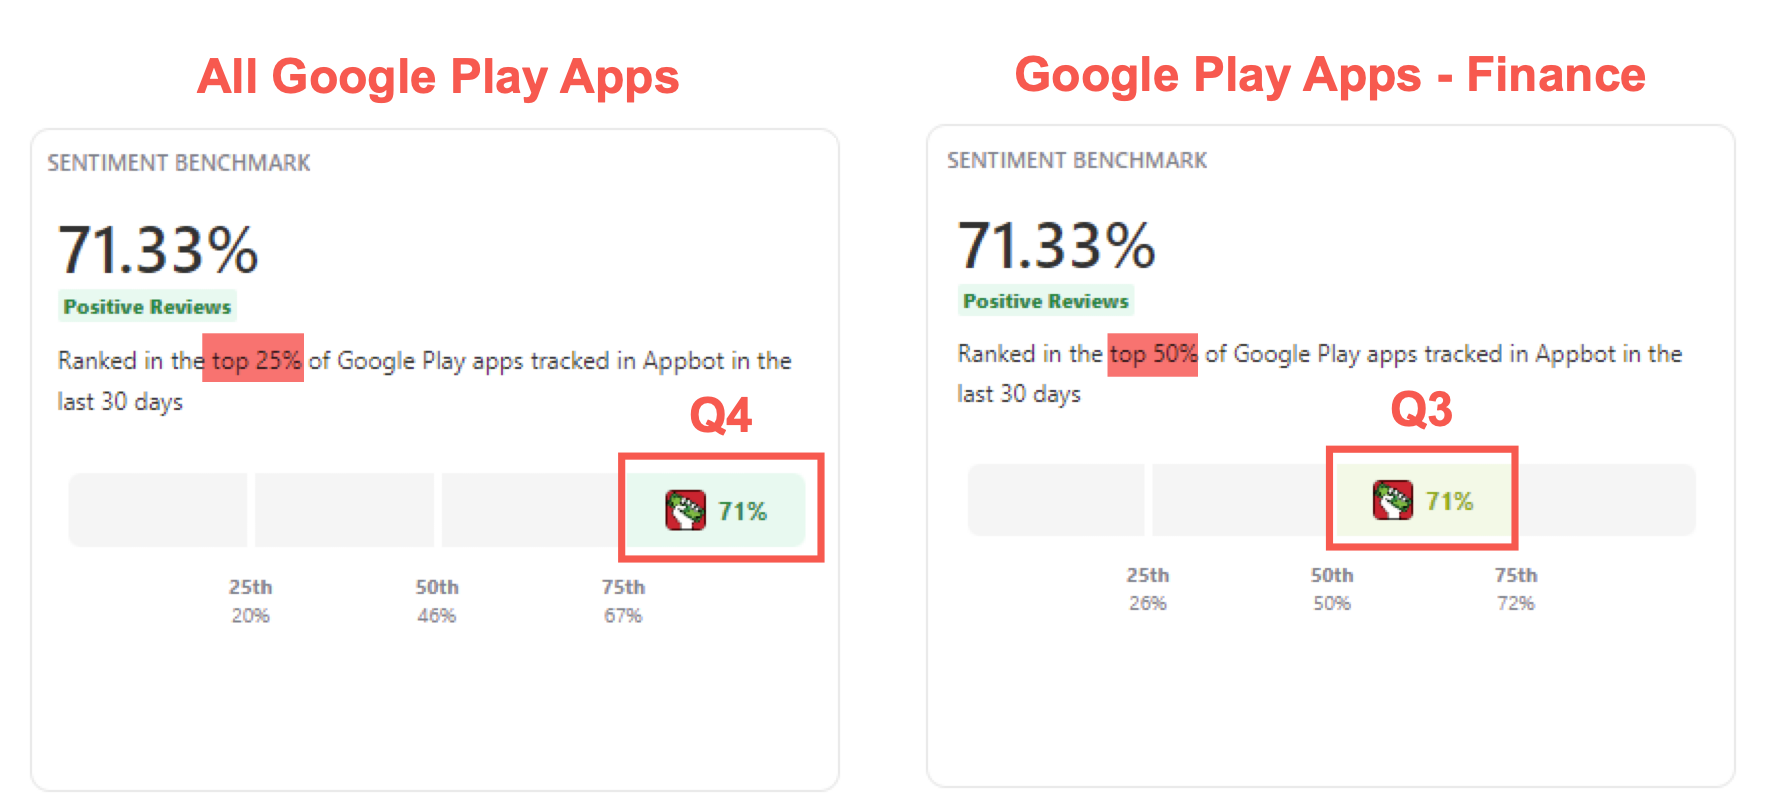
- The app’s quartile position for positive review sentiment – at 71.33% it is in the fourth quartile (Q4) or the top 25%, as it has a higher positive percentage than 75% of the apps (2.)
- Shows the quartiles and their percentiles, as well as the positive sentiment percentage for each one. In the example above, Q1 or the 25th percentile has a positive sentiment percentage of 20%.
App Benchmark Comparison Options
Benchmarks focuses on reviews and only shows the last 30 days. Using the filter on the right you can compare your app with:
- All apps tracked in Appbot from the same app store. This is the default.
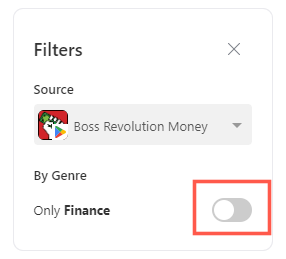
- All apps from the same store and the same genre (as categorized by the app developer and listed in the app stores). By analysing apps in your specific category, you gain more relevant and targeted insights. To see the genre benchmarks select the Only Category button in the filter, as shown below.
The number of reviews, positive sentiment and average star rating are for the app you have selected, so those figures stay the same regardless of if you choose all apps or the genre.
Utilizing the Benchmarking Page for Success
The Benchmarking Page provides crucial information to make informed decisions and optimize your app’s performance. Here are some tips to leverage its potential:
- Identify Areas for Improvement: By comparing your review volume, ratings, and sentiment with competitors, you can identify strengths and weaknesses. Focus on improving areas that lag behind others or where negative sentiment is prevalent.
- Benchmark against Similar Apps: Utilize the genre filter option to analyze apps within your specific category. This allows for more accurate comparisons and insights that directly impact your target audience.
- Track Trends and Progress: Regularly monitor your app’s performance using the Benchmarking Page. Note any changes or trends over time and adapt your strategies accordingly to stay ahead of the competition.
