The Appbot Compare page gives you a high-level overview of the apps you’re tracking on Appbot. You can use it for comparing the performance of your apps or other sources, or benchmarking against competitors. Just select the sources you want to look at from the filter pane on the right to compare the sentiment score, star rating, trend and review volume..
Comparing Your Sources
At the top of the page, you will see a graph that displays either ‘Review Volume’ and ‘Review Stars’. You can toggle between by using the labels at the top of the chart (item 1 below).
Open the filter pane on the right to select different sources, change the date range or filter by ‘Topics & Tags’ or by ‘Detected Language’ (item 2 below).
Add and remove sources from the chart by clicking on the eye icon beside each one (item 3 below).
Source Stats Table
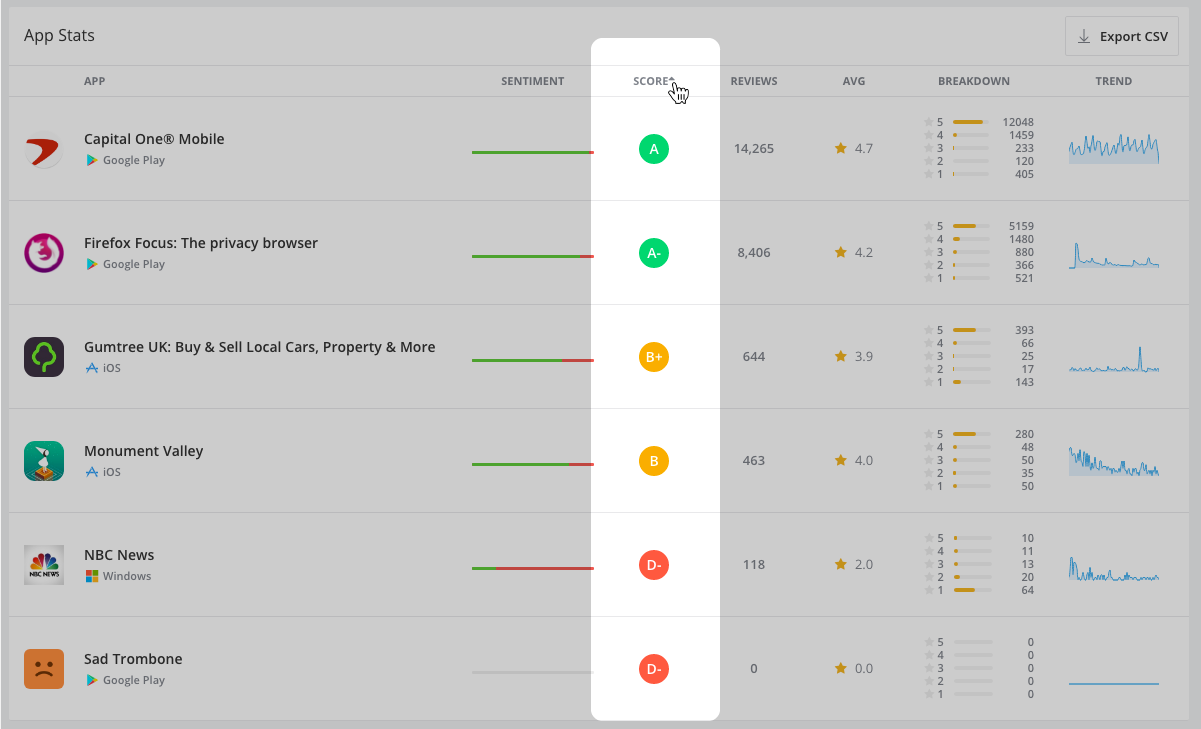
Below the graph, you’ll see a simple comparison table listing all your selected sources. You can click on any ‘source name’ or ‘sentiment score’ from the table to go to the Sentiment page for that particular source for a more detailed analysis.
If you’re tracking a lot of sources, you might want to view the table in order of a particular metric (column). By clicking on any of the headings – ‘Sentiment’, ‘Score’, ‘Reviews, or ‘Avg’, you can re-order the table according to that metric or score.
To export the data in this table, just click the ‘Export’ button at the top right, to download a CSV or Excel (.xlsx) file.
If you need any further assistance, don’t hesitate to contact us or check out our FAQ section here.

