Appbot Dashboards allow you to build your own reports by choosing widgets that offer the metrics you’re interested in measuring. This guide provides a brief description of each widget available.
The results for each widget will reflect the time period you have selected for the Dashboard, as well as any filters you have applied to that particular widget (such as country, version or star rating).
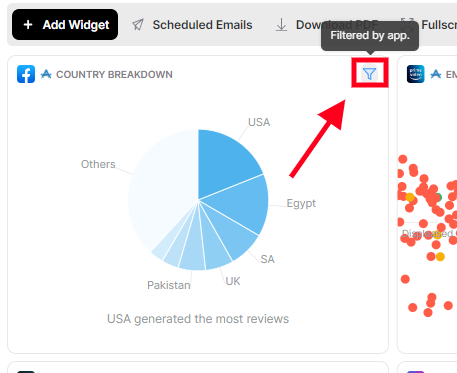
Note: If you’ve applied filters to a widget we recommend renaming that widget to reference those filters. You can do this in the Edit Widget screen:
Country/Language Breakdown
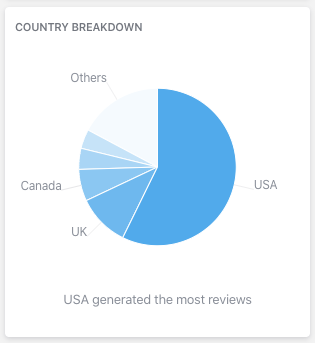
The Country/Language Breakdown widget shows the breakdown of countries (iOS apps) or languages (Google Play apps) for the selected time period.
Hovering on any section of the pie chart will show the number of reviews that the country made and the percentage that it makes up of the total.
>>> Find more information on Appbot Countries and Languages.
Top Countries/Languages
The Top Countries/Languages widget shows the top 5 countries (iOS apps) or top 5 languages (Google Play apps) for the selected time period. Countries or languages are ranked in descending order of popularity.
The numbers to the right of each country or language show the count of reviews for that country or language. Below the count, you’ll see the percentage of overall reviews for that period.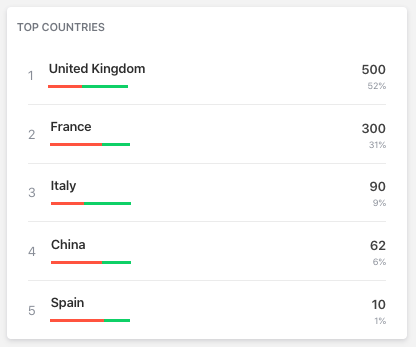
Emotion Breakdown
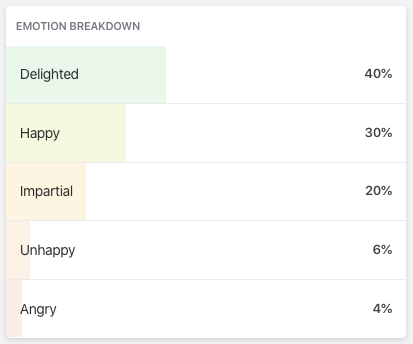
The Emotion Breakdown widget shows the percentage of reviews that match to each emotional group in Appbot for the selected time period.
Emotion Scatter
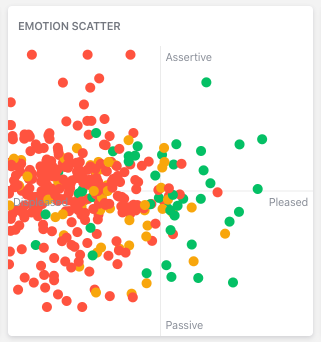
The Emotion Scatter widget is a visual representation of the emotions of your app reviewers.
Each colored dot represents 1 review. If you hover over an individual dot on the Emotion Scatter you’ll find the specific review associated with that emotion/dot. You can click specific reviews to see the review in more detail and even reply by clicking ‘Reply in Store’.
>>> Find more information on Emotions.
Free Text
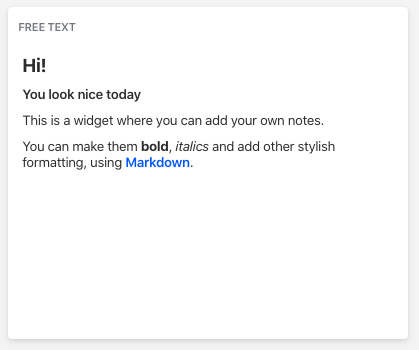
The Free Text widget allows you to insert segments of markdown supported text into a dashboard. This can be useful for adding notes, particularly if you print the dashboard as a PDF.
Average Rating
The Average Rating widget shows the average star rating for your source for the time period selected. Hover on the series to find a detailed star breakdown for each day.
Cumulative Ratings Count
The Cumulative Ratings Count widget shows the cumulative count of ratings for the selected time period. Hover on the series to find a detailed star breakdown for each day.
Review Stars
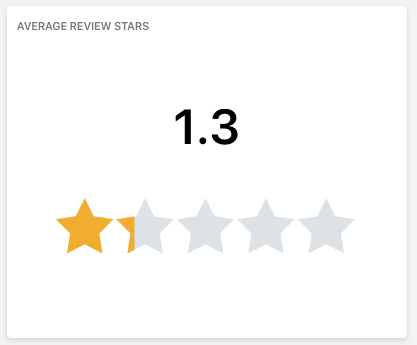
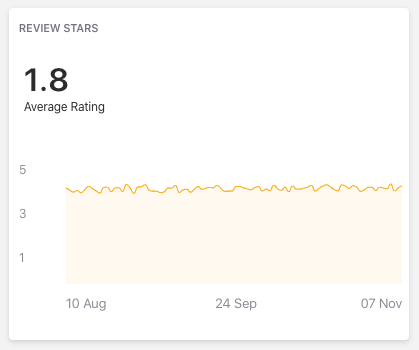
The Average Review Stars widget calculates the average star rating from reviews with text for the selected time period.
Review Stars Breakdown
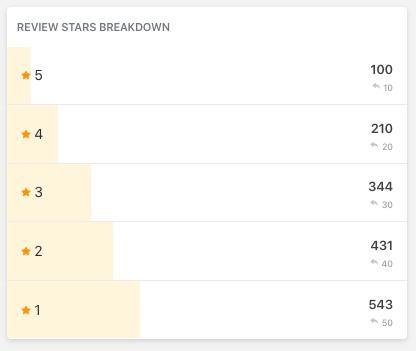
The Average Review Star Breakdown widget shows the number of reviews with text for each star rating during the selected time period.
Reviews Count
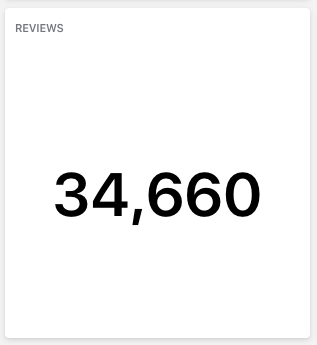
The Reviews Count widget shows a count of all reviews for the selected time period.
Reviews Latest
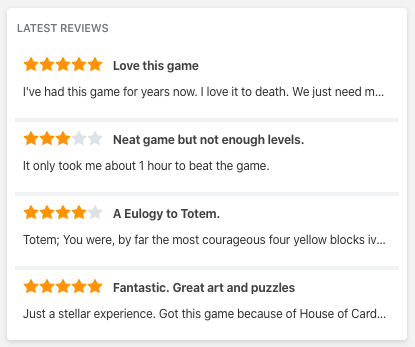
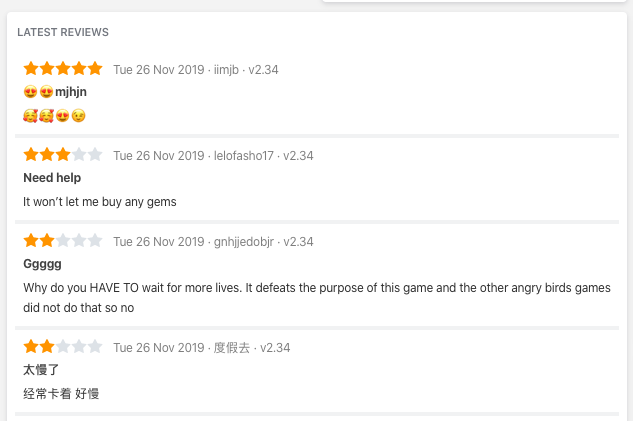
The Latest Review widget shows a snippet of the most recent reviews for the selected time period.
If you’d like to see more detail in these reviews, you can also select a Latest Review widget that presents a larger snippet.
Reviews Timeline
The Reviews Timeline widget shows an average star rating for reviews with text for the selected period of time.
Reviews Volume
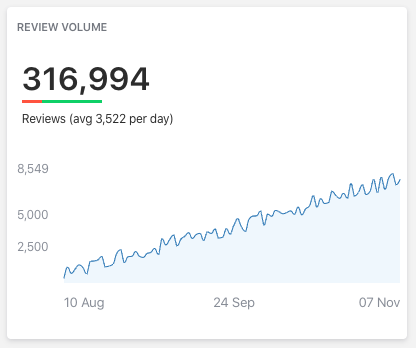
The Reviews Volume widget shows your review volume per day, total review count, and sentiment breakdown for the selected period of time and any applied filters.
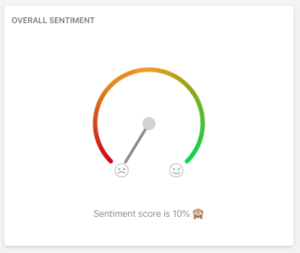
Sentiment Score
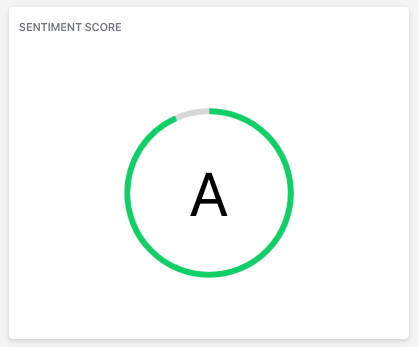
The Sentiment Score widget shows the Appbot Sentiment Score for the period you’ve selected. The open part of the circle shows you how much scope there is for improvement.
>>> Find more information on Sentiment Score.
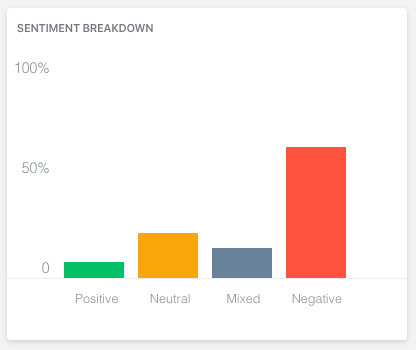
Sentiment Breakdown
The Sentiment Breakdown widget shows the percentage breakdown of positive, neutral and negative reviews for the period selected.
Sentiment Overall
The Overall Sentiment widget provides a visual representation of where this app’s sentiment sits on the overall spectrum of possible sentiment results.
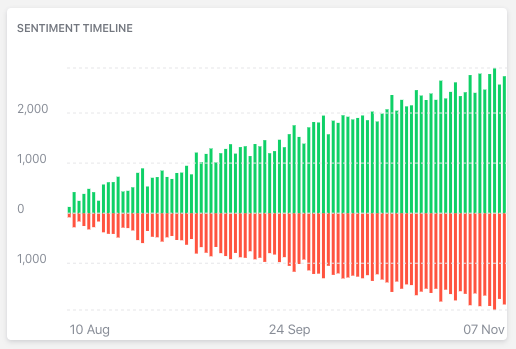
Sentiment Timeline
The Sentiment Timeline widget shows the count of positive and negative reviews per day for the selected period.
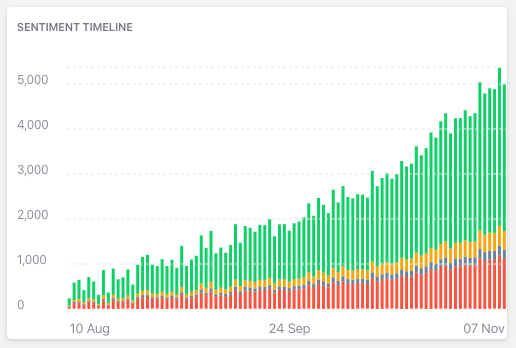
Sentiment Timeline Stacked
The Sentiment Timeline Stacked widget is a stacked bar chart showing the count of positive, neutral and negative reviews per day for the selected period.
Sentiment Suggestions
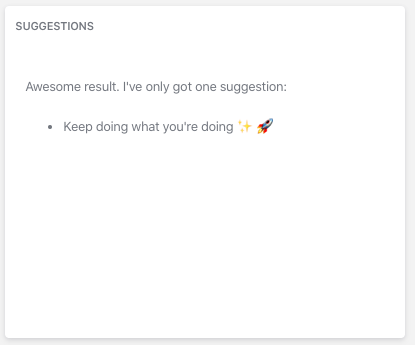
The Sentiment Suggestions widget provides a list of areas and ideas to improve, based on the selected time period.
Topics Mentions
The Topics or Tag Mentions widget shows the number of reviews that mention a specific topic during the selected time period. In the top left corner of the widget, you’ll see the count and sentiment breakdown for the reviews that mention this topic.
Top Topics & Tags
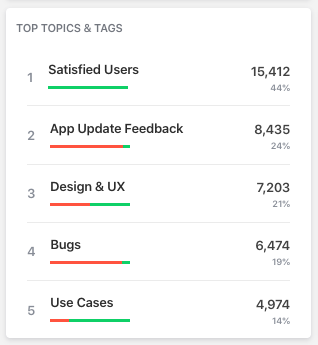
The Top Topics & Tags widget shows the 5 most popular and frequently mentioned Topics, Tags or Custom Topics in your reviews over the selected time period. The numbers to the right of each Topic or Tag show the count of reviews and the percentage of overall reviews for that Topic or Tag.
Top Topics
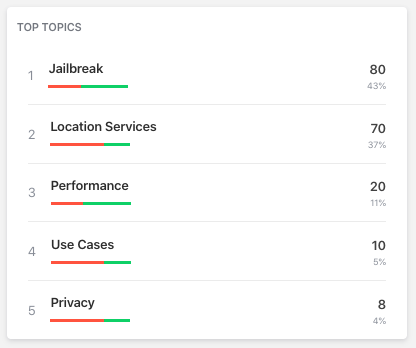
The Top Topics widget shows an overview of the sentiment and review count for the top five topics during the selected time period.
Top Custom Topics
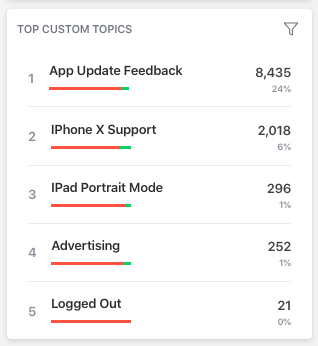
The Top Custom Topics widget shows the sentiment and review count for the top five custom topics for the selected time period.
In order for the Top Custom Topics widget to work, you’ll need to create your own custom topics under the Custom Topics tab in the navigation menu.
>>> Find more information on how to create Custom Topics.
Top Tags
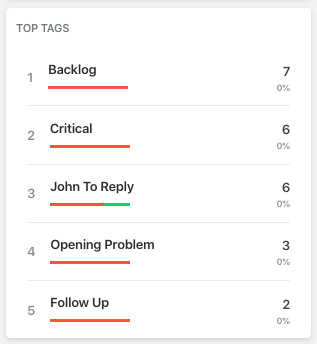
The Top Tags widget shows an overview of the sentiment and review count for the top five tags for the selected time period.
In order for the Top Tags widget to work, you’ll need to add your custom tags to reviews.
>>> Find more information on how to create Custom Tags.
Versions Breakdown
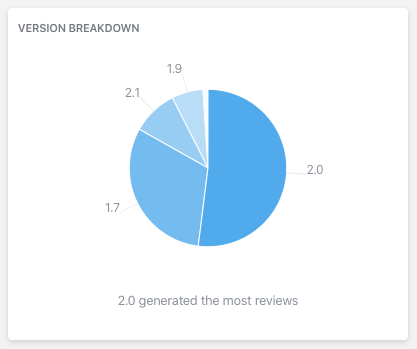
The Versions Breakdown widget shows the breakdown of reviews categorized version during the selected time period.
Hovering on any section of the pie chart will show the number of reviews that the version received and the percentage of the total.
Top Versions
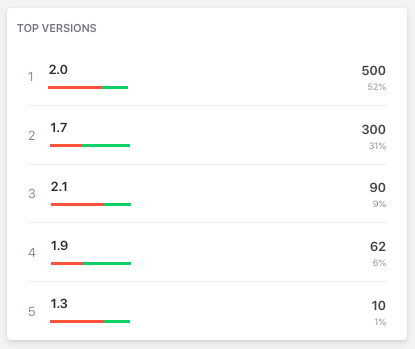
The Top Versions widget shows the top 5 versions of the app or source based on the number of reviews in the selected time period. Versions are ranked in descending order of popularity.
The numbers to the right of each version show the count of reviews. Below the count, you’ll see the percentage of overall reviews for that version.
Note: the Versions widget is only available for iOS apps.
>>> Find more information on Versions.
Top Critical Words
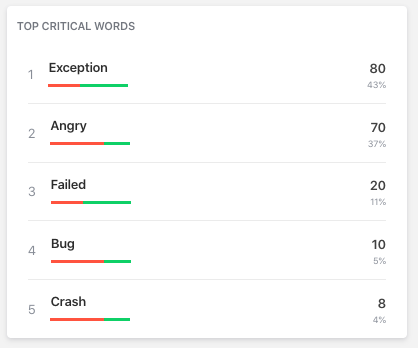
The most Critical Words widget shows the top five words in your reviews, ranked by criticality over the selected time period.
Critical Words are used to quickly locate and fix problems in your app. Each word includes a sentiment breakdown and its number of occurrences.
Top Interesting Words
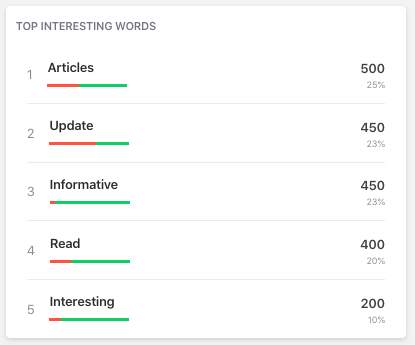
The most Interesting Words widget shows the top five words in your reviews, ranked by how interesting they are over the selected time period. These words can be useful to drill into and may uncover some surprises in your reviews. Interesting Words include sentiment breakdowns and the number of occurrences for each.
Top New Words
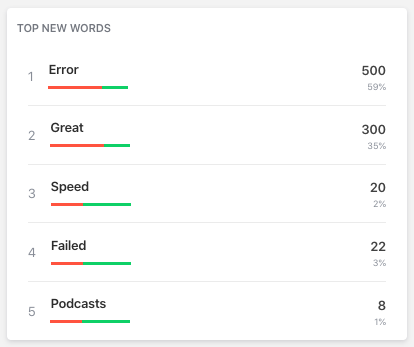
The Top New Words widget shows the top five words in your reviews, ranked by how new they are and their frequency over the selected time period. Each word includes a sentiment breakdown and the number of occurrences.
Top Popular Words
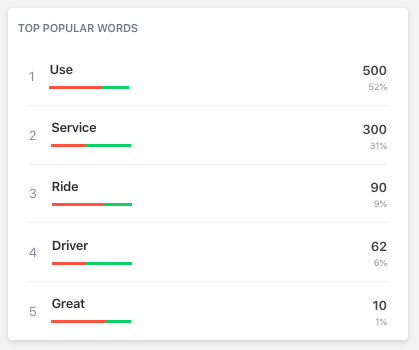
The most Popular Words widget shows the top five words in your reviews, ranked by popularity over the selected time period. Each word includes a sentiment breakdown and the number of occurrences.
Top Downwards Trending Words
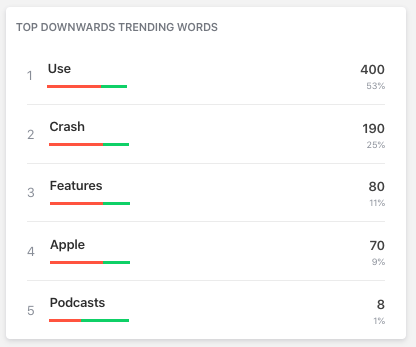
The most Downward Trending Words widget shows the five words in your reviews that are ranked by their downward trend over the selected time period. The words include sentiment breakdowns and the number of occurrences for each.
Top Upwards Trending Words
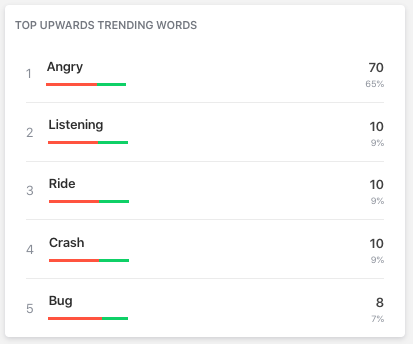
The most Upward Trending Words widget shows the top five words in your reviews ranked by their upward trend over the selected time period. The words include a sentiment breakdown and the number of occurrences for each.
